How Do Supermarkets Make Money? (The Secret Behind 1–2% Profit Margins)
A modern supermarket can sell everyday essentials like milk, eggs, and bread at razor-thin margins or outright losses and still generate billions in enterprise revenue. With average food retail net profit margins hovering at just 1% to 2%, here is the hidden business model supermarkets use to turn volume, aisle psychology, trade spend, and customer baskets into massive corporate profits.

Try our free Profit Margin Calculator to calculate your gross margin, net profit margin, and retail markups across your product mix.
1. The 1% to 2% Reality: Why High Sales Do Not Equal High Profits
Supermarkets operate on some of the thinnest bottom-line margins in global industry, typically capturing between 1.0% and 2.0% in net profit across the retail food sector. While a large regional supermarket may generate $40 million to $60 million in gross annual revenue, its actual take-home net profit rarely exceeds $400,000 to $1,000,000.
Consider the breakdown of a typical $100 checkout receipt: roughly $77 to $78 immediately flows out to food manufacturers, agricultural distributors, and wholesalers for Cost of Goods Sold (COGS). The remaining $22 to $23 in gross profit must fully cover cashier and stocker wages, 24/7 refrigeration power, distribution center leases, transportation freight, point-of-sale software, theft, and expired food write-offs. After all overhead and corporate taxes are settled, the store keeps only $1.50 to $2.00.
This razor-thin dynamic is clearly illustrated by major industry giants. Kroger reported a gross margin of 22.9% for fiscal 2025; however, after supporting thousands of physical storefronts and a continental logistics network, its ultimate net margin compressed to approximately 1.5%. Supermarkets survive not by charging large markups, but by turning enormous inventory volumes at relentless speed.
- The $100 Grocery Receipt Reality: $77 goes to wholesale inventory (COGS), $12 to store wages and benefits, $4 to facility leases and refrigeration electricity, $3 to logistics and technology, $2 to shrink and spoilage, leaving just $2 in net profit.
- The Velocity Engine: A traditional retail boutique might turn its inventory 3 to 4 times a year at 50% margins; a supermarket turns its entire inventory 15 to 22 times annually to survive on 2% margins.
- Asymmetrical Risk: At a 2% net profit margin, if an employee drops and breaks a $20 bottle of imported olive oil, the store must sell $1,000 in additional groceries just to recoup the lost net profit.
2. Basket Economics: Why the Basket Matters More Than the Product
Supermarkets rarely evaluate individual product profitability in isolation. Instead, store leadership practices "basket economics"—an analytical framework that optimizes the aggregate gross margin of the total shopping cart rather than maximizing profit on individual items.
Consumers have sharp price recall for a small group of staple items known as Key Value Items (KVIs): a gallon of whole milk, a dozen eggs, a loaf of sandwich bread, and a pound of bananas. If these basic essentials appear expensive, shoppers instinctively assume the entire grocery store is overpriced and take their business elsewhere.
Consequently, supermarkets price KVIs at cost or even as negative-margin loss leaders to build store foot traffic. Once the shopper is inside the store, cross-merchandising ensures high-margin discretionary items land in the same shopping cart. A store may earn almost zero profit on a $3.49 gallon of milk, but easily captures a 45% gross margin on the gourmet cookies, bakery pastries, or cold brew sitting beside it in the dairy aisle.
- Key Value Items (KVIs): Staples like milk, eggs, bananas, and ground beef are fiercely price-matched against local competitors to establish price trust.
- Promotional Contagion: Offering a loss-leader discount on chicken breasts triggers secondary purchases of high-margin marinades, specialty spices, charcoal, and craft beer.
- Cross-Subsidization: Low-margin grocery staples (10%–15% gross margin) are systematically subsidized by high-margin non-food items, greeting cards, and floral bouquets (40%–60% gross margin).
3. Aisle Architecture and Psychological Store Layout
Supermarket floor plans are meticulously engineered environments designed to guide customer navigation and convert quick, disciplined shopping lists into extended browsing journeys.
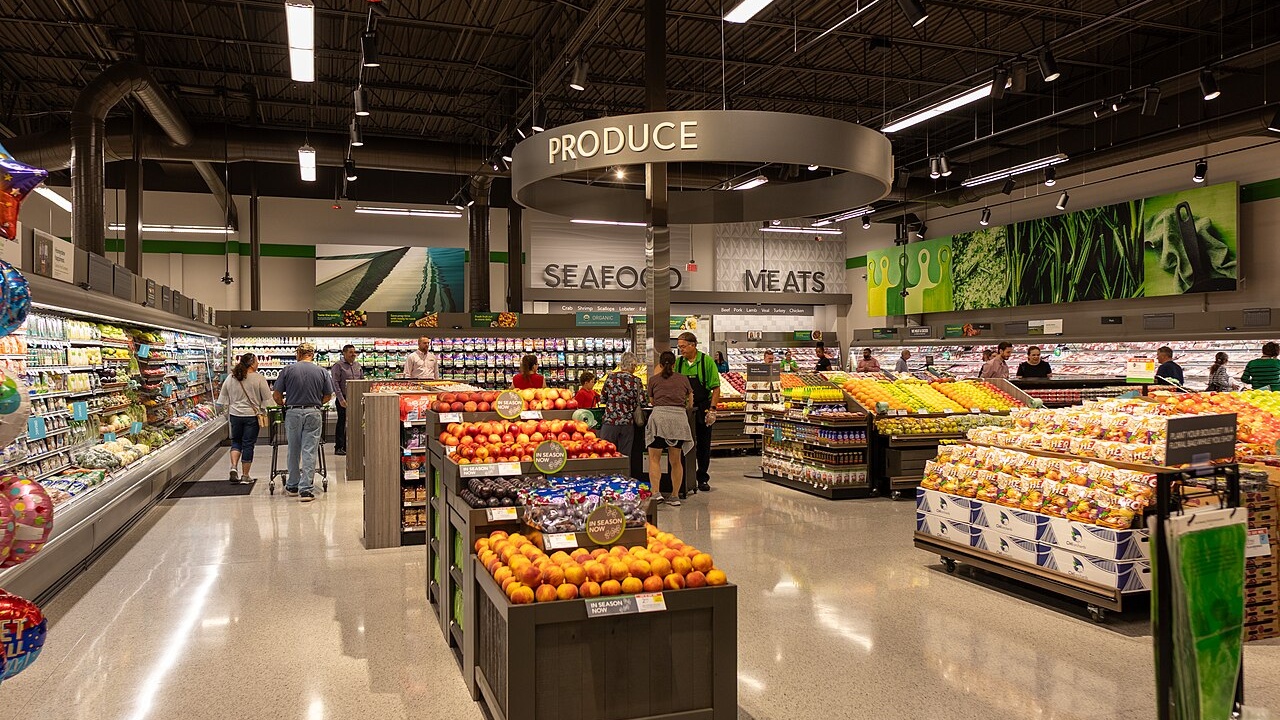
The sensory journey begins the moment a customer enters the front doors into the produce and floral department. Bright natural lighting, vibrant fruit displays, and the aroma of fresh-cut flowers trigger psychological feelings of health, freshness, and abundance. This positive emotional priming makes shoppers more receptive to impulse spending throughout the rest of the store.
Essential staples like milk, dairy, and eggs are deliberately positioned along the back wall or at opposite perimeter corners. While logistics and walk-in coolers partially dictate back-wall placement, the architectural effect is undeniable: shoppers must traverse hundreds of feet of center aisles stocked with packaged, shelf-stable, high-margin consumer packaged goods to reach everyday necessities.
- Eye Level Is Buy Level: Premium national brands and high-margin specialty items are stocked at adult eye level (50–60 inches from the floor). Value and bulk items sit on the bottom shelf, while sugary cereals sit at children's eye level (30–40 inches).
- Endcap Dominance: The displays at the ends of aisles ("endcaps") represent the most lucrative shelf space in retail, driving 30% to 40% of packaged goods volume with a 2x to 4x sales lift over mid-aisle placement.
- The Checkout Gauntlet: The checkout lane is engineered for zero-contemplation impulse purchases: single-serve candy, cold energy drinks, batteries, and magazines boasting 50%+ gross margins.
5. The Private Label Revolution: Boosting Margins with Store Brands
One of the most powerful profit levers in modern grocery retailing is the aggressive expansion of private label (store brand) products, such as Kroger's Simple Truth, Costco's Kirkland Signature, and Trader Joe's proprietary lines.
Traditional national brands carry heavy marketing overhead, national TV ad budgets, and corporate broker commissions that inflate their wholesale costs. To sell national brands, supermarkets must accept modest 15% to 20% gross margins. By contrast, store brands bypass advertising agencies and contract directly with third-party food manufacturers, enabling supermarkets to capture 25% to 35%+ gross margins.
Supermarkets strategically position store brands directly beside leading national brands on the shelf. The retailer prices the store brand 15% to 25% lower than the national brand, providing shoppers with perceived value while earning significantly more net dollar profit on the transaction.
- Cost Advantage: Private labels eliminate multimillion-dollar marketing campaigns and licensing fees, lowering unit acquisition costs.
- Higher Retained Profit: Even when sold at a 20% consumer discount, store brands deliver 8% to 15% higher gross margin percentages to the retailer.
- Supplier Negotiation Leverage: If a national brand attempts to raise wholesale prices, the supermarket can expand shelf facings for its store brand, forcing the national manufacturer to negotiate.
6. Data Monetization: Loyalty Programs and Retail Media Networks (RMNs)
Supermarket loyalty programs have evolved far beyond basic paper coupon discounts into sophisticated first-party consumer analytics platforms and high-margin advertising networks.
Every loyalty card swipe or mobile app scan links individual transactions to household demographics, logging basket composition, purchase intervals, brand switching habits, and price sensitivity. Supermarkets aggregate and monetize this proprietary data, selling syndicated shopper insights back to consumer goods manufacturers.
Furthermore, leading grocery chains have built proprietary Retail Media Networks (RMNs). Brands now pay supermarkets millions of dollars to run sponsored search ads on grocery websites, push targeted digital coupons within mobile apps, and display video ads on digital screens positioned above deli counters and checkout lanes. Unlike physical groceries that net 2%, retail media ad sales deliver staggering 60% to 80% operating profit margins.
- First-Party Consumer Profiling: Retailers track household buying patterns with pinpoint accuracy, delivering algorithmic, personalized digital discounts that maximize cart size.
- Retail Media Advertising: Monetizing digital screen real estate, in-app sponsored listings, and search banners transforms grocery storefronts into advertising media channels.
- Omnichannel Integration: Blending in-store POS data with online grocery ordering apps allows retailers to charge premium advertising rates to CPG marketing teams.
7. The Perishable Inventory Tightrope: Shrink, Spoilage, and Cold-Chain Logistics
Because grocery stores operate on razor-thin 1% to 2% net margins, inventory "shrink"—the combined losses from shoplifting, employee theft, cashier scan errors, and perishable spoilage—represents a constant operational threat.
Industry shrink averages between 1.5% and 2.0% of total sales across retail food chains. In a business where net margins are also 2%, a minor spike in inventory shrink can completely erase annual store profitability.
Managing fresh meat, seafood, dairy, and produce requires delicate inventory precision. Ordering too much leads to catastrophic spoilage and dumpster write-offs; ordering too little results in out-of-stock items, empty shelves, and frustrated shoppers who abandon their weekly baskets. Supermarkets deploy automated algorithmic demand forecasting and dynamic markdown schedules to sell aging perishables before they spoil.
- The Perishability Clock: Fresh produce and prepared foods lose commercial value in 48 to 72 hours; dynamic markdown stickers (e.g., "Manager's Special 30% Off") salvage inventory cost.
- Continuous Cold-Chain Power: Commercial refrigeration accounts for roughly 40% to 50% of a supermarket's total electrical bill, creating rigid, non-negotiable overhead costs.
- Shrink Mitigation: Smart camera computer vision at self-checkout lanes and electronic article surveillance (EAS) tags protect high-theft categories like meat, baby formula, and cosmetics.
8. Supermarket Margin Breakdown by Department: From Staples to Specialties
Gross profitability varies dramatically across the departments of a modern supermarket. The low margins on grocery staples are balanced by premium margins in perimeter departments:
Understanding how different departments balance velocity against gross markup is critical for modeling retail profitability. Use our financial calculators to evaluate your own product margins.
| Department | Typical Gross Margin | Inventory Turnover Speed | Spoilage / Shrink Risk | Core Strategic Role in Store |
|---|---|---|---|---|
| Dairy & Fluid Milk | 10%–18% | Extremely Fast (25–35x/yr) | Moderate (Date-sensitive) | Price-anchor Key Value Item (KVI); drives weekly foot traffic |
| Fresh Produce | 35%–45% | Fast (20–30x/yr) | High (Visual decay & shrink) | Sensory entrance hook; high gross margin contribution |
| Meat & Seafood | 25%–35% | Fast (18–25x/yr) | High (Perishable cut loss) | Center-of-plate anchor; high basket value builder |
| Center Store Packaged Food | 20%–26% | Moderate (10–14x/yr) | Very Low (Long shelf life) | Core pantry volume; steady cash flow and supplier trade spend |
| Deli & Prepared Foods | 40%–55% | Fast (Daily turnover) | Very High (Labor intensive) | High-margin convenience capture; grabs quick lunch and dinner spend |
| In-Store Bakery | 45%–60% | Fast (Daily bake) | High (Day-old discounts) | Aroma priming; highest gross markup percentage in food |
| Health, Beauty & General Merchandise | 35%–50% | Slow (4–6x/yr) | Low (Non-perishable) | Impulse margin booster; non-food cross-subsidization |
Keep exploring Percentio
Browse the full directory to find related calculators and compare the assumptions that matter to your situation.
Browse all financial calculators →Related Blogs


Questions and answers
Practical answers to common planning questions.